Architecture and data flow
The pipeline runs detection, orchestration, and case management as three decoupled layers, with the SIEM only needing to know one webhook URL:
- Agents on Windows and Linux endpoints ship logs and Sysmon events to the Wazuh manager over an encrypted channel on 1514/tcp.
- The manager decodes events against the bundled ruleset plus the custom rules in
local_rules.xml. - Any alert at level 10 or higher matches the
<integration>block and the manager invokescustom-thehive, which forwards a normalized payload to the Shuffle webhook. - Shuffle resolves the indicator of interest (source or destination IP), pulls reputation from VirusTotal and OTX, and computes a verdict score.
- A TheHive case is opened with the score-derived severity, the indicator is attached as an observable flagged as an IOC, and the analyst channel gets a message linking the case.
The handoff lives in the manager's ossec.conf - level 10 is the line between “stays in the dashboard” and “worth a case”:
<integration>
 <name>custom-thehive</name>
 <hook_url>SET_FROM_ENV_SHUFFLE_WEBHOOK_URL</hook_url>
 <level>10</level>
 <alert_format>json</alert_format>
</integration>
The stack
The SIEM and case-management side is one Compose project of seven services: the three Wazuh components, plus TheHive backed by Cassandra and Elasticsearch with Cortex available for observable analyzers. Versions are pinned across the board - Wazuh 4.9.0, TheHive 5.4, Cortex 3.1.8, Cassandra 4.1, Elasticsearch 7.17.20. A trimmed excerpt:
services:
 wazuh.indexer:
 image: wazuh/wazuh-indexer:4.9.0
 ports:
 - "9200:9200"
 environment:
 - OPENSEARCH_JAVA_OPTS=-Xms1g -Xmx1g
 - bootstrap.memory_lock=true

 wazuh.manager:
 image: wazuh/wazuh-manager:4.9.0
 depends_on:
 - wazuh.indexer
 ports:
 - "1514:1514"
 - "1515:1515"
 - "55000:55000"

 thehive:
 image: strangebee/thehive:5.4.0-1
 depends_on:
 - cassandra
 - elasticsearch
 - cortex
 ports:
 - "${THEHIVE_PORT}:9000"
Shuffle runs as its own four-service Compose project (shuffle-database on OpenSearch 2.14.0, shuffle-backend, shuffle-frontend, shuffle-orborus, all pinned to 1.4.0) so it survives a teardown of the SIEM side.
Custom detections
local_rules.xml adds eleven detections on top of the Wazuh ruleset, each mapped to a MITRE ATT&CK technique so cases arrive tagged:
| Rule | Detection | Technique |
|---|---|---|
| 100101 | Process launched from a user-writable path | T1059 |
| 100102 | Office application spawns a scripting host | T1566 / T1059.001 |
| 100110 | Suspicious LSASS access (credential dumping) | T1003.001 |
| 100120 / 100121 | New service and scheduled-task persistence | T1543.003 / T1053.005 |
| 100200 / 100201 | SSH and RDP brute force | T1110 |
| 100210–100212 | CTI watchlist hits (IP, domain, hash) | T1071 / T1204 |
The LSASS-access rule is the kind of thing the bundled ruleset doesn't ship - it keys off a Sysmon process-access event against lsass.exe with one of the granted-access masks that credential dumpers request:
<rule id="100110" level="12">
 <if_sid>61609</if_sid>
 <field name="win.eventdata.targetImage" type="pcre2">(?i)\\lsass\.exe$</field>
 <field name="win.eventdata.grantedAccess" type="pcre2">0x1010|0x1410|0x143a|0x1fffff</field>
 <description>Suspicious LSASS access - possible credential dumping</description>
 <mitre>
 <id>T1003.001</id>
 </mitre>
</rule>
The SOAR workflow
The exported Shuffle workflow (wazuh-thehive-enrichment.json) is a webhook trigger fanning into seven actions: a router that picks the indicator, parallel VirusTotal and OTX lookups, a Python scoring step, TheHive case creation, observable attachment, and a Slack notification. The router and both lookups feed the scoring node, which gates everything downstream. The scoring step turns reputation counts into a TheHive severity:
vt = int($action_vt.last_analysis_stats.malicious or 0)
otx = int($action_otx.pulse_info.count or 0)
score = vt * 2 + otx
severity = 3 if score >= 6 else (2 if score >= 2 else 1)
return {"score": score, "severity": severity, "vt_malicious": vt, "otx_pulses": otx}
The case node carries the agent, the rule, the reputation counts, and the raw log into the description, and tags the case with the rule's MITRE id. A missing VirusTotal result is coerced to zero rather than failing the case creation, so the free tier's 4 req/min limit never drops an alert. The indicator is then attached as an observable flagged as an IOC, so it flows into TheHive's observable history and can be swept against other cases.
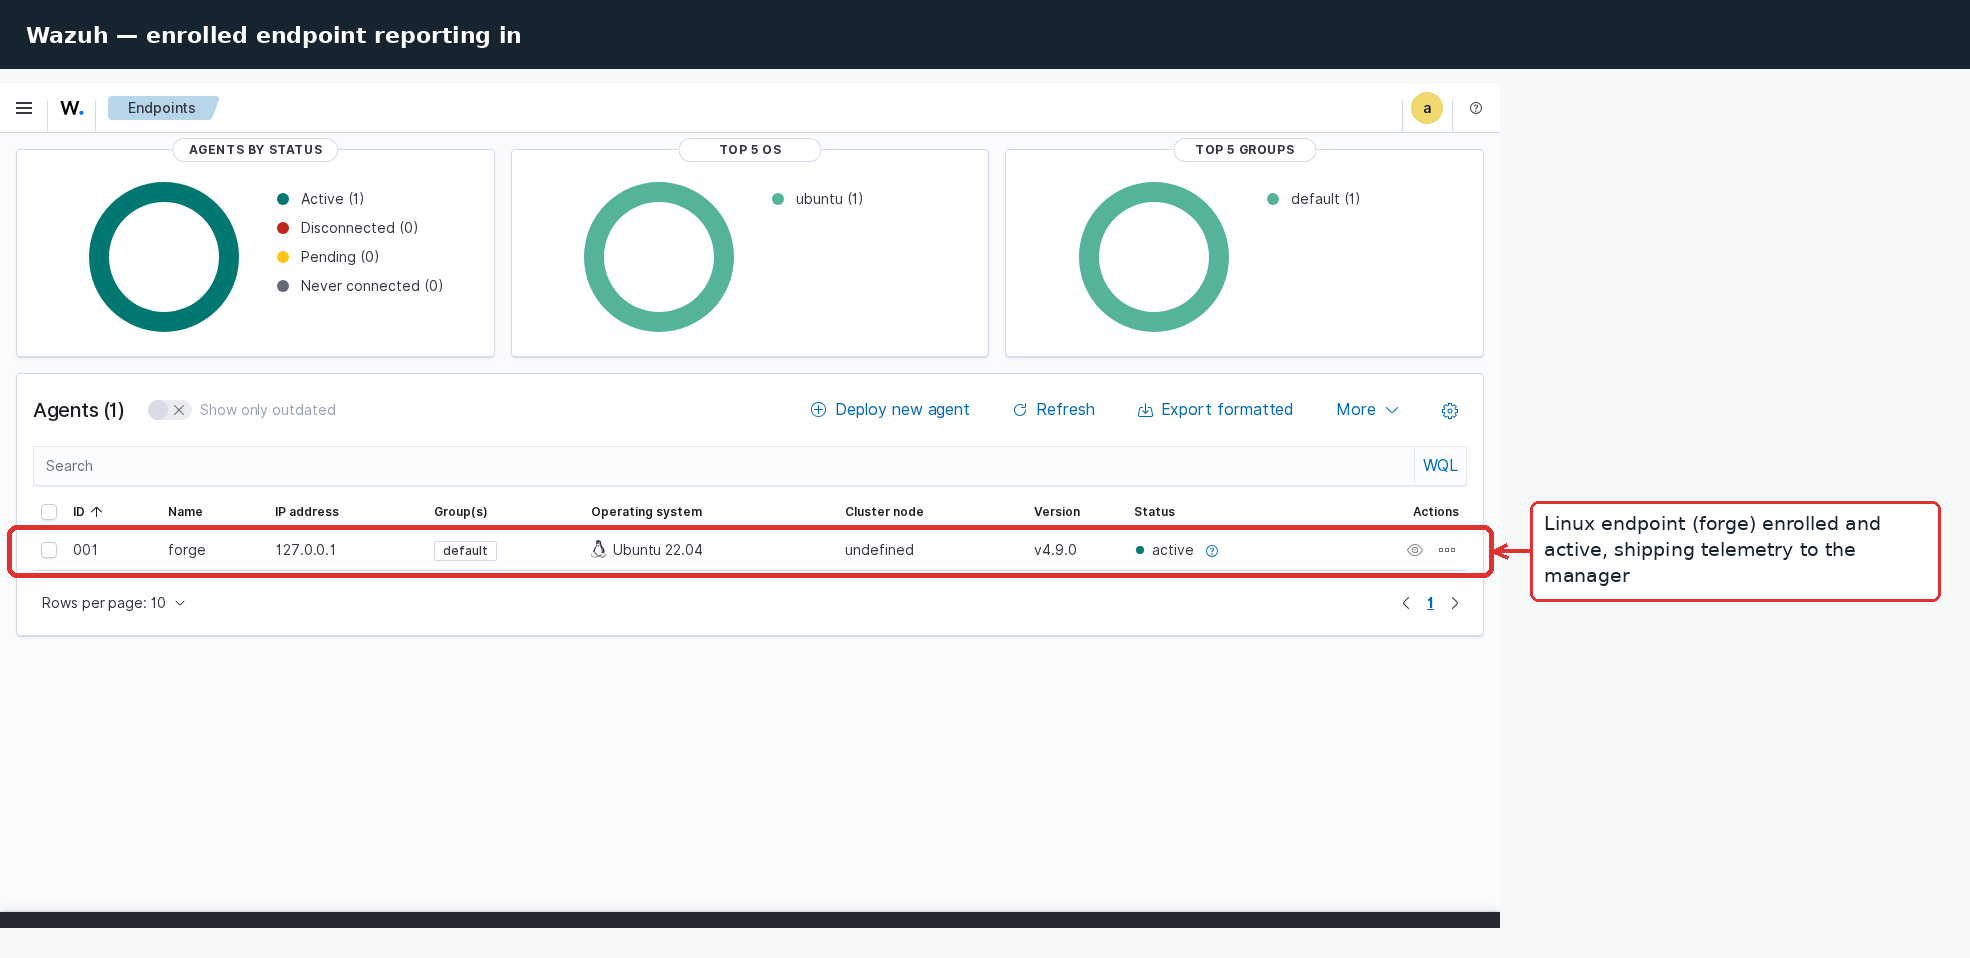
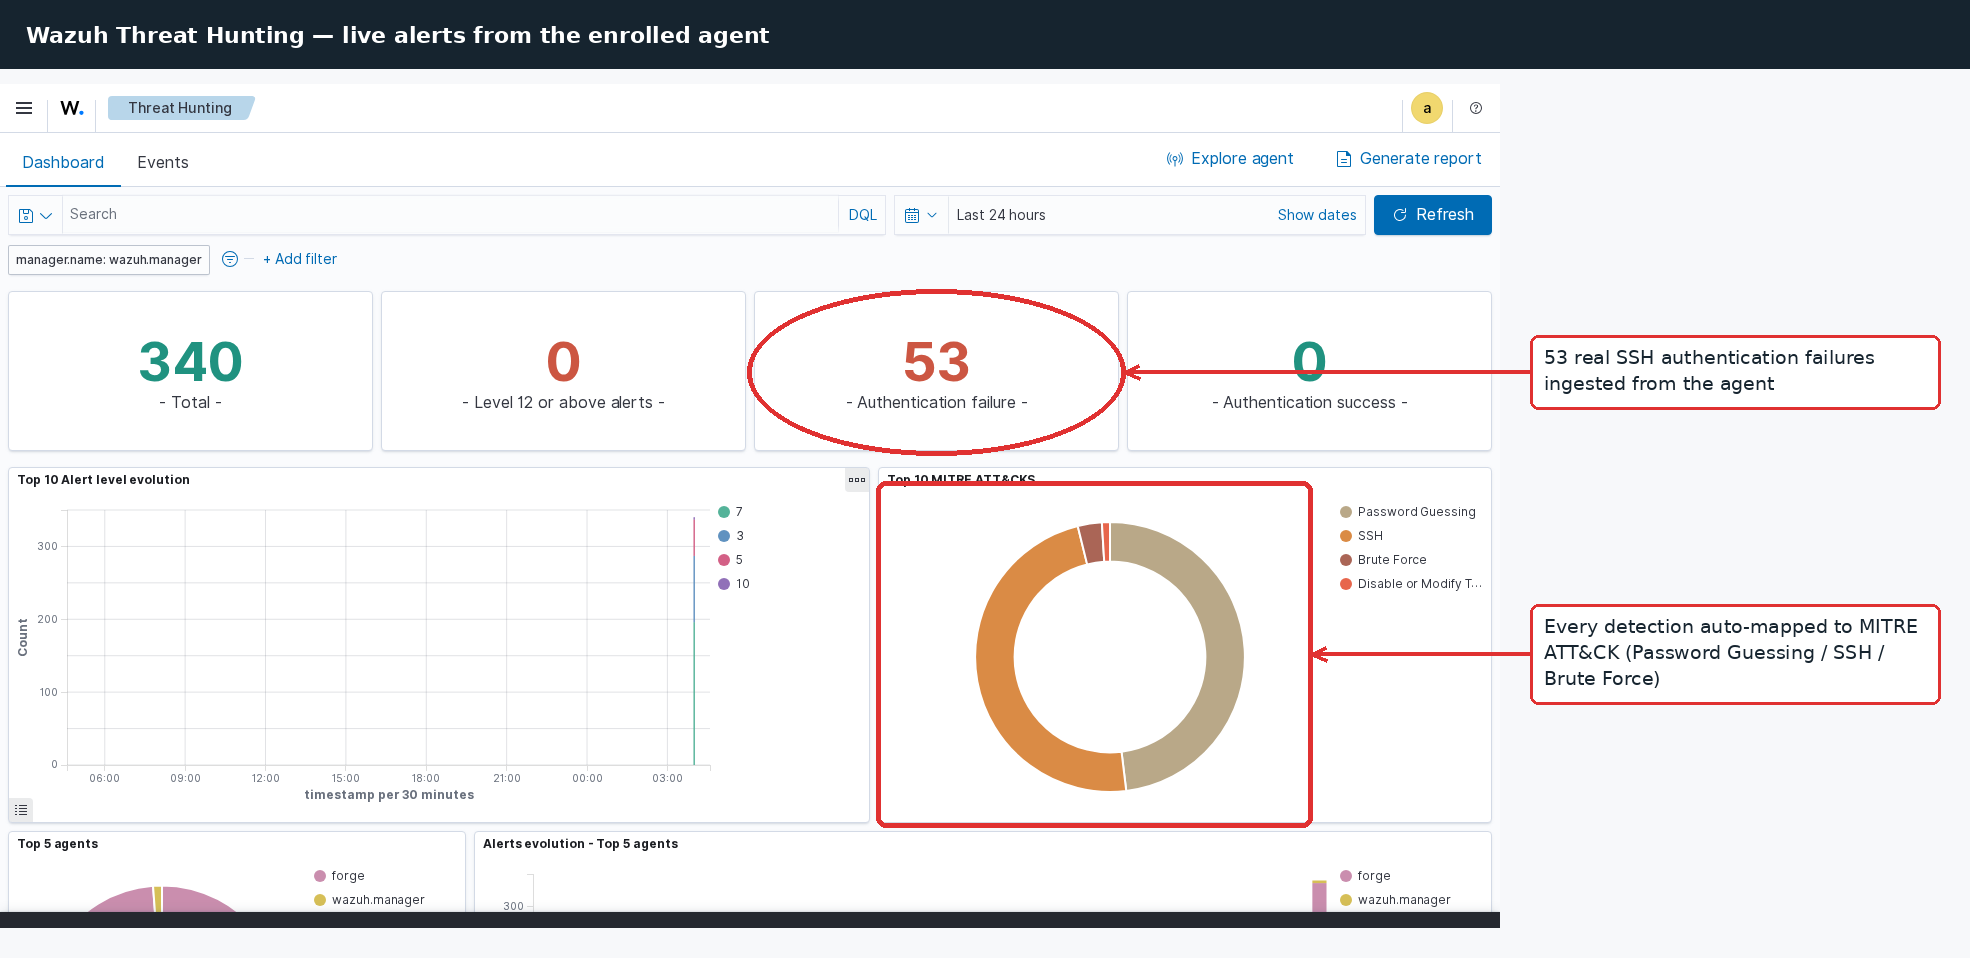
Live validation
The lab was stood up single-node with a Linux endpoint (forge, Ubuntu 22.04) enrolled and reporting in, then an SSH brute force was replayed against it. The Threat Hunting dashboard showed 340 total alerts with 53 real SSH authentication failures ingested from the agent, every detection auto-mapped to MITRE ATT&CK across Password Guessing, SSH, and Brute Force categories. The escalation rule that fired collapses a burst of Wazuh's per-failure 5710 events into one level-10 brute-force alert:
<rule id="100200" level="10" frequency="8" timeframe="120">
 <if_matched_sid>5710</if_matched_sid>
 <same_source_ip />
 <description>SSH brute force - 8 failed logins from $(srcip) in 120s</description>
 <mitre>
 <id>T1110</id>
 </mitre>
</rule>
For CTI-list hits, rule 100210 is also wired to active response: the manager issues a firewall-drop on the endpoint for 600 seconds while the analyst confirms. The block is scoped to a single rule on purpose - auto-blocking on a noisier rule would be a fast way to firewall yourself out of your own hosts.
Agent enrollment
The manager runs registration on 1515/tcp with force enabled so a re-enrolling host reclaims its slot rather than piling up duplicates. Linux endpoints enroll through a helper that adds the Wazuh apt repo and installs the agent pinned to the manager's version:
curl -s https://packages.wazuh.com/key/GPG-KEY-WAZUH | gpg --no-default-keyring \
 --keyring gnupg-ring:/usr/share/keyrings/wazuh.gpg --import
echo "deb [signed-by=/usr/share/keyrings/wazuh.gpg] https://packages.wazuh.com/4.x/apt/ stable main" \
 > /etc/apt/sources.list.d/wazuh.list
apt-get update
WAZUH_MANAGER="${WAZUH_MANAGER}" WAZUH_AGENT_GROUP="${WAZUH_AGENT_GROUP}" \
 apt-get install -y "wazuh-agent=${WAZUH_VERSION}"
systemctl enable --now wazuh-agent
Windows hosts use a PowerShell counterpart that pulls the MSI and registers it into the Sysmon-aware windows group, so process-creation and network events arrive with enough context for the rules above to be useful:
WAZUH_MANAGER=10.0.0.10 ./scripts/enroll-agent.sh
.\scripts\enroll-agent.ps1 -Manager 10.0.0.10 -Group windows
Deployment notes
A few things that bit during bring-up and are worth knowing before running this somewhere real:
- Indexer compatibility. Filebeat 7.10 refuses to publish to an indexer that reports an OpenSearch 2.x version, so the indexer config sets
compatibility.override_main_response_version: true. Without it the manager produces alerts but nothing reaches the indexer and the dashboard stays empty. - Memory locking under LXC. The committed config locks memory (
bootstrap.memory_lock=true,memlock: -1), which is correct for bare metal. Inside an unprivileged LXC the kernel caps locked memory and the indexer and Elasticsearch fail with an rlimit error; the fix is adocker-compose.override.ymlthat disables locking rather than editing the committed file. - vm.max_map_count. Must be at least 262144 on the host for both the indexer and Elasticsearch; in an LXC it's inherited from the node, so it has to be set there.
- CTI watchlists. The
cti-malicious-*CDB lists are seeded bydeploy.shafter the stack is up - they have to be writable so the manager can compile them, which rules out bind-mounting them read-only.
This is a lab build. Production would split the Wazuh indexer and TheHive's Cassandra and Elasticsearch onto their own nodes with real resource headroom.